
Dashboard overview
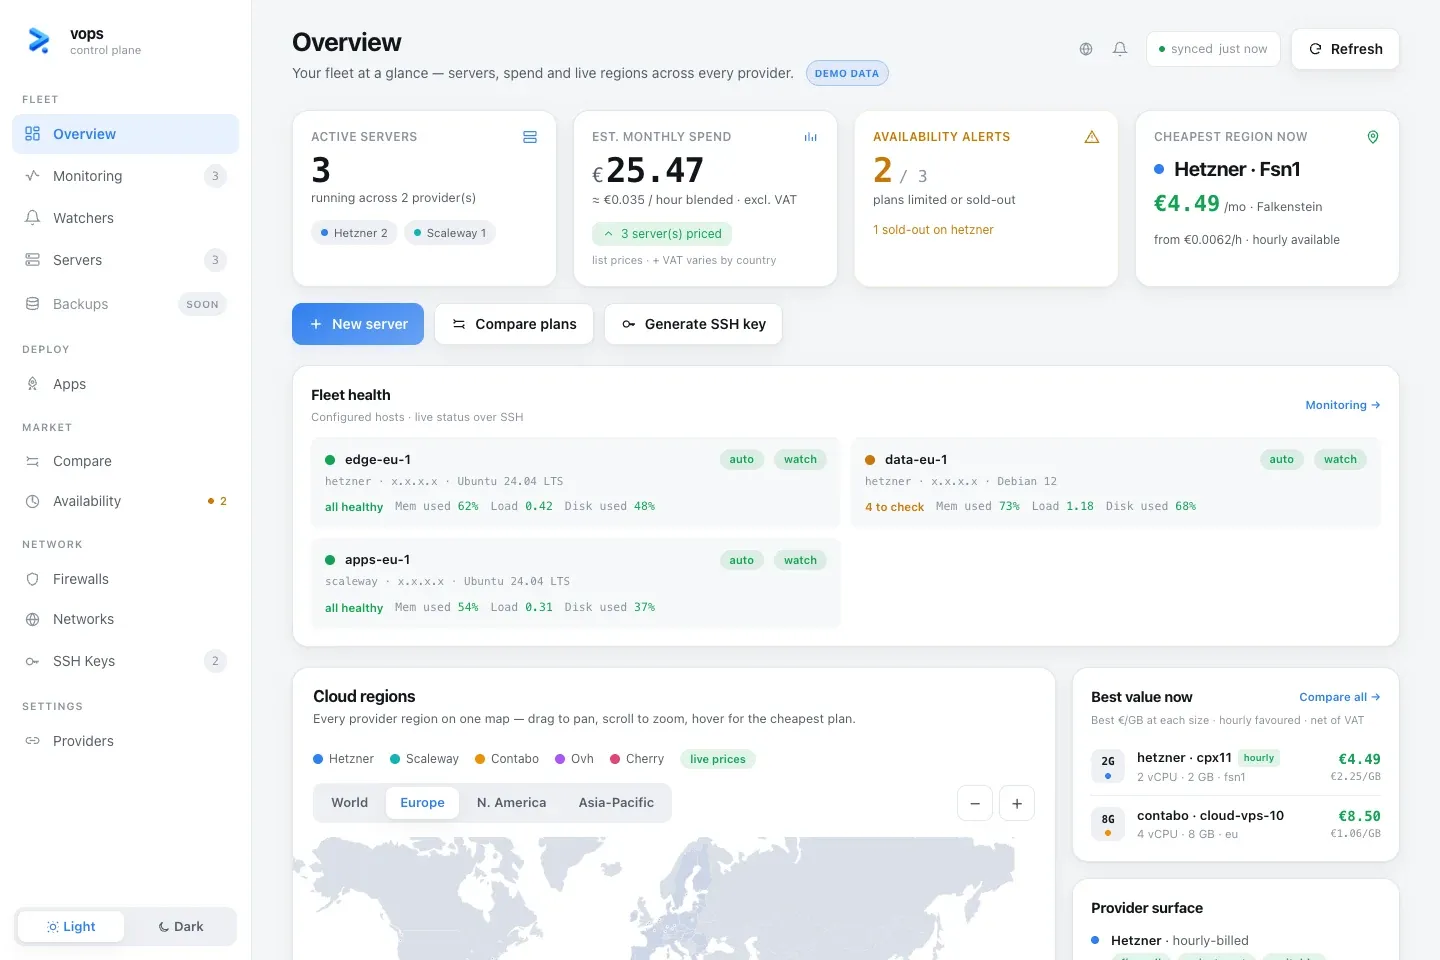
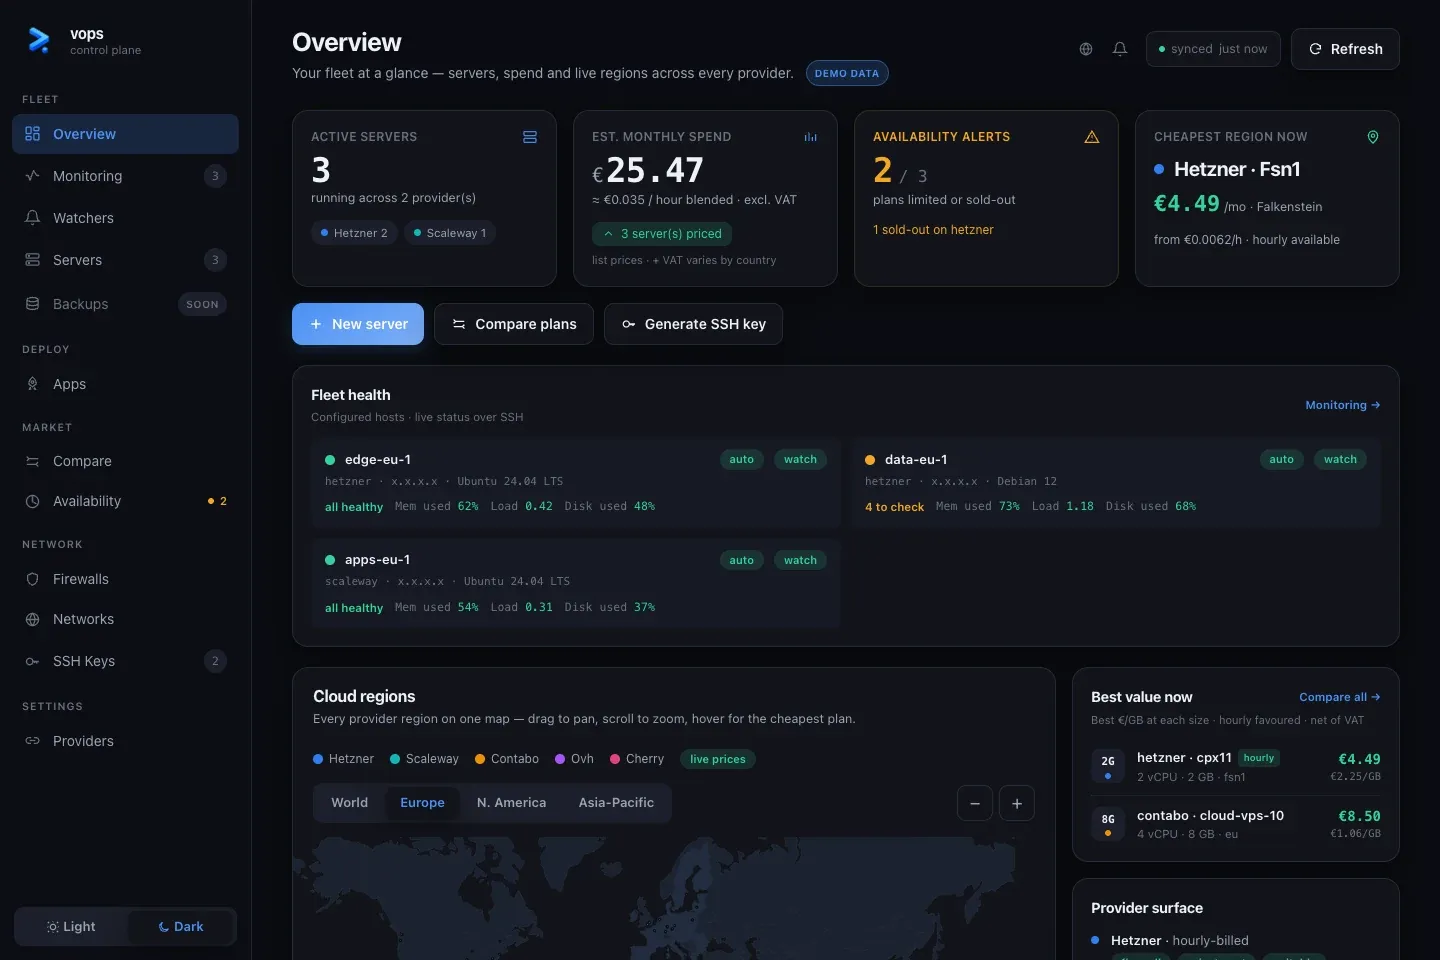
The dashboard is the visual surface of the local vops control plane. It does not have a separate cloud backend or a second implementation of provider and host operations: the browser calls a loopback API backed by the same services and profile as the CLI.
Start the dashboard
vops uivops prints a session-protected URL, opens it in the default browser and keeps
the local API running until the terminal process stops. Use --no-open when you
want to open the URL yourself.
The default address is on 127.0.0.1:7788. If that port is occupied, an
interactive run can choose a temporary local port and tells you that it did.
Navigation
The released dashboard is grouped by the work being done:
| Group | Views | Purpose |
|---|---|---|
| Fleet | Overview, Monitoring, Watchers, Servers | Inventory, live SSH health and outside alerts. |
| Deploy | Apps | Catalog installs, your own applications and day-two actions. |
| Market | Compare, Availability | Price, capability and stock research. |
| Network | Firewalls, Networks, SSH Keys | Access and network resources. |
| Settings | Providers | Local provider connections and credential state. |
Backups is visible as soon in the current navigation. Backup commands are
already available in the CLI, but the dashboard view is not presented as
released.
The controlled-agent branch adds an Agents view under Settings. Its
documentation is marked preview until that branch ships.
Understand the data source
Not every number on a dashboard has the same freshness or privacy boundary:
| Data | Source |
|---|---|
| Provider capability | Static capability registry in the installed vops version. |
| Plans, prices and account servers | Public or authenticated provider API, with local caching where applicable. |
| Host health | Live SSH probes from the workstation. |
| Application state and logs | Live SSH reads plus the local install inventory. |
| Watches | The explicitly connected hosted notification relay. |
| Agent sessions and audit | Local control-plane store. |
The page should say when a value is cached, provider-only or unavailable because SSH is not configured. A blank live metric is not the same thing as a healthy zero.
Dashboard or CLI?
Use the dashboard for orientation, comparison and reviewing related state in one place. Use the CLI when you need:
- a complete flag set;
- deterministic
--jsonoutput; - a durable command to put in a runbook;
- an immutable deployment plan;
- diagnostics that must be preserved in a report.
Dashboard actions should expose or point to their CLI equivalent whenever the operation is not obvious.
Safety cues
Read-only actions can refresh immediately. A persistent or destructive action must make its consequence visible before execution. In particular, removing a local inventory record, removing an application and deleting a provider server are three different effects and must not share ambiguous wording.
The dashboard cannot widen a permission denied by the core service. A disabled button is a usability hint; the backend ownership, approval and credential checks remain the security boundary.